Performance Comparison: Berkshire Hathaway Inc. vs Major Indexes Since 1994.
- Dow Jones Industrial Average (DJIA)
- Nasdaq Composite Index (IXIC)
- S&P 500 Index (SPX)
- Russell 2000 Index (RUT)

Performance Comparison: Berkshire Hathaway Inc. vs Major Indexes Since 1994.
- Dow Jones Industrial Average (DJIA)
- Nasdaq Composite Index (IXIC)
- S&P 500 Index (SPX)
- Russell 2000 Index (RUT)
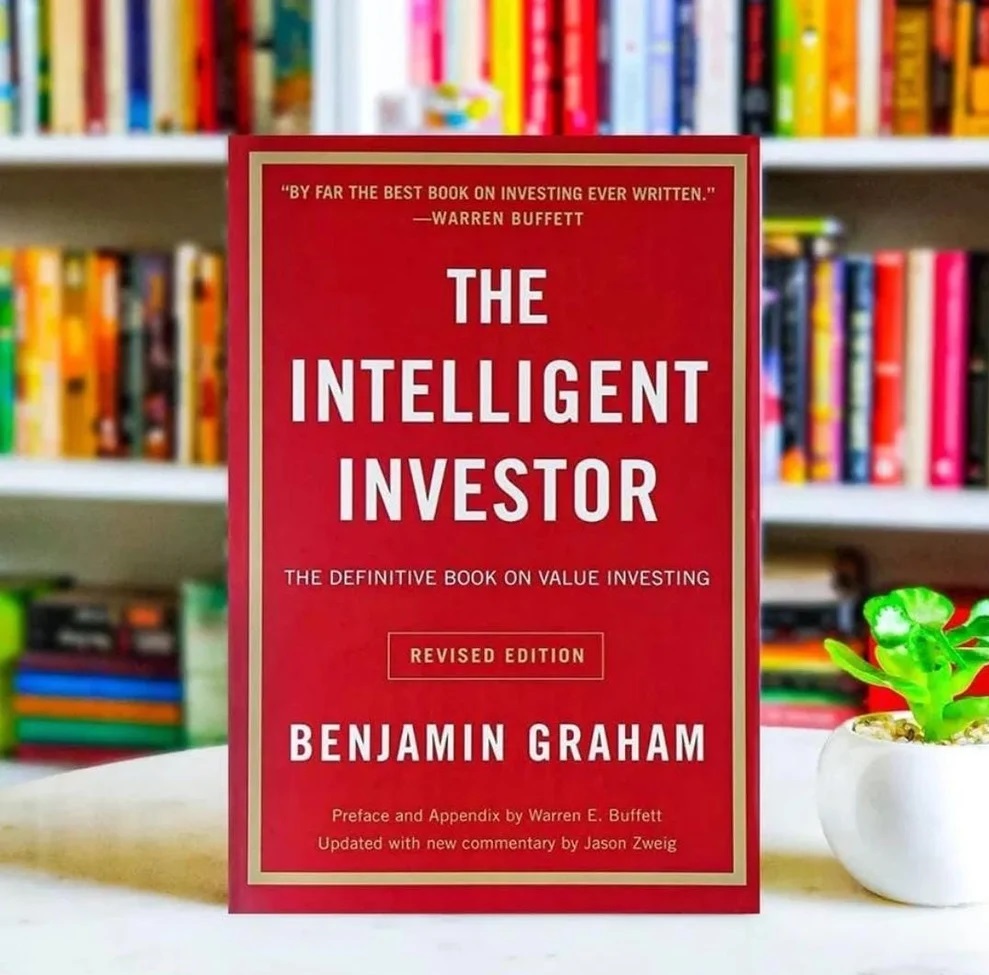
Mastering Stock Charts: Lessons From “The Intelligent Investor” And Warren Buffett
To Effectively Read Stock Charts, Start By Immersing Yourself In The Lessons From “The Intelligent Investor” By Benjamin Graham And The Insights Of Warren Buffett. Understanding The Basics Is Crucial: Stock Charts Depict A Stock’s Price Over Time, Often Using Candlesticks To Indicate The Opening, Closing, High, And Low Prices.
Understanding The Basics
Start By Recognizing That Stock Charts Provide A Visual Representation Of A Stock’s Price Movements. Candlesticks Are Typically Used In These Charts, Displaying Four Essential Data Points: Opening, Closing, High, And Low Prices For Each Period. Each Candlestick Provides A Snapshot Of How The Stock Performed During That Time Frame. Learning To Read These Candlesticks Is Foundational To Understanding Stock Charts.
Identifying Key Patterns And Indicators
Next, Delve Into Identifying Trends And Key Patterns. Look For Upward Or Downward Trends To Understand The General Direction In Which The Stock Is Moving. Key Levels Known As Support And Resistance Indicate Where The Stock Tends To Stop And Reverse Direction. Moving Averages, Calculated By Averaging A Stock’s Price Over A Specific Number Of Days, Help Smooth Out Price Data To Identify Trends Over Time. These Indicators Are Vital For Gauging Market Sentiment And Identifying Potential Entry Or Exit Points In Trades.
Insights From Graham And Buffett
Benjamin Graham’s Approach To Value Investing Emphasizes Taking A Long-Term View Of Stock Performance. According To Graham, Investing Should Focus On Buying Undervalued Stocks That Have Strong Fundamentals And Holding Them Until Their Market Price Reflects Their Intrinsic Value. Warren Buffett Builds On Graham’s Principles; Both Focus On The Fundamentals Of A Company Beyond What The Charts Can Show.
Buffett’s Strategic Insights
Buffett’s Investment Strategy Involves Thorough Analysis Of A Company’s Financial Health, Management Quality, And Competitive Advantage, Rather Than Relying Solely On Technical Chart Patterns. His Approach Highlights The Importance Of Understanding A Company’s Intrinsic Value, Which Can Lead To More Informed And Potentially Successful Investment Decisions.
Chart Analysis And Fundamental Assessment
While Understanding And Analyzing Stock Charts Can Provide Valuable Insights Into Market Trends And Potential Trading Opportunities, It Is Crucial To Integrate These Findings With A Comprehensive Assessment Of The Company’s Fundamentals. Following Graham’s Value Investing Principles And Buffett’s Focus On Intrinsic Value Can Lead To More Informed And Potentially Successful Investment Decisions.
Summary: A Balanced Approach To Investing
Relying Solely On Charting Is Not Considered A Sound Investment Strategy; Instead, It Should Be One Component Of A Broader, Well-Rounded Investment Approach. Combining Technical Analysis With A Deep Dive Into A Company’s Financials And Strategic Positioning Can Provide A More Holistic View, Enabling Investors To Make Better Decisions. This Balanced Approach, Advocated By Both Graham And Buffett, Ensures That Investments Are Backed By Solid Research And Understanding, Reducing The Risks Associated With Purely Technical Trading.

Comments
One response to “How To Read Stock Chart?”
[…] Full […]